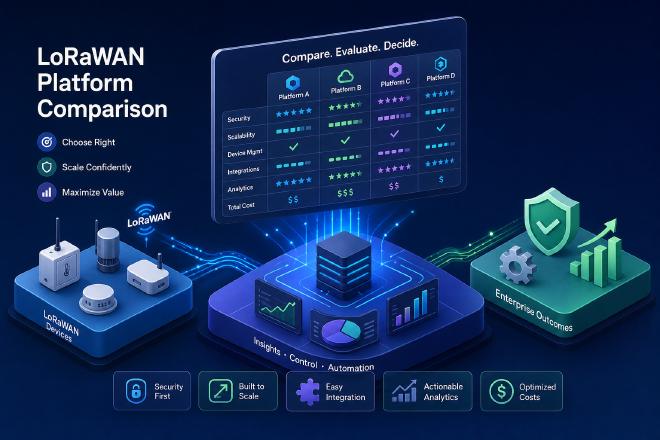
How do LoRaWAN monitoring platforms compare for enterprise use? That’s the question most procurement teams should be asking, but they often end up comparing dashboards when they should be comparing operational architectures. Most platforms claim enterprise-readiness, yet the differences in how they handle RF visibility, alarm intelligence, SLA documentation, and scale only become apparent the moment a real network failure hits. This guide cuts through that noise. We’ll walk through five critical evaluation dimensions, map the major platform types against each other, and give you a structured scorecard you can put in front of any vendor.
If you’ve heard of platforms like Kudzu Canopy NOC, it’s because a meaningful benchmark now exists for what AI-native LoRaWAN operations actually look like. Understanding why that benchmark matters helps clarify every other comparison in this guide.
What enterprise LoRaWAN monitoring actually demands#
Generic IoT management tools display device status. Enterprise LoRaWAN monitoring does something fundamentally different: it tracks the health of your entire radio access network continuously, not just the endpoints. That includes gateway uptime, RF signal quality at the packet level, Adaptive Data Rate (ADR) behavior, and Packet Delivery Ratio (PDR) trends across every node in your deployment. Without these metrics, operators are flying blind during degradation events that look normal on a device dashboard but are silently destroying SLA performance.
LoRaWAN networks fail in ways that standard IoT platforms aren’t designed to detect. RSSI can look acceptable while SNR drops below demodulation threshold. PDR can deteriorate slowly over weeks before it triggers a client complaint. Capacity saturation on a gateway happens quietly, not catastrophically. Platforms built on generic IoT frameworks don’t compute these metrics natively. They expose raw telemetry and leave operators to connect the dots manually, which defeats the purpose of a network operations center entirely. The distinction between a monitoring dashboard and a true NOC platform starts here, and it’s the first thing to probe when evaluating how LoRaWAN monitoring platforms compare for enterprise use.
How do LoRaWAN monitoring platforms compare for enterprise use, scalability and deployment architecture#
Scalability in LoRaWAN isn’t just about device count. It’s about how the platform handles traffic load, multiregion deployments, and multi-tenant isolation simultaneously. LoRaWAN Alliance capacity studies show a wide variance between academic estimates (up to 100,000 end devices per gateway under ideal conditions) and real-world operational ceilings, which depend heavily on duty cycle constraints, channel configuration, and traffic patterns. See an industry analysis on improving LoRaWAN scalability for practical constraints operators face in production deployments. Actility ThingPark Enterprise, the most documented platform on this dimension, supports up to 300,000 devices across 1,000 gateways in its largest hardware tier, while open-source options like ChirpStack require significant infrastructure engineering to reach comparable reliability.
The deployment model shapes your total cost of ownership more than almost any other decision. Managed LoRaWAN platforms charge per device per month, typically $0.50 to $3.00 depending on volume, which keeps upfront costs low but compounds quickly at scale. Private deployments eliminate per-device connectivity fees by leveraging unlicensed spectrum, but shift costs to infrastructure, staffing, and operations tooling. At 10,000 devices over five years, the full network TCO difference between managed and private ranges from roughly $200K on the managed low end to over $1M at standard pricing, versus $150K to $450K for a well-run private deployment. For deployments exceeding 10,000 devices with a five-year horizon, private networks typically achieve payback in under 18 months.
The real question isn’t which model is cheapest in isolation. It’s which model your team can operate without building out a large internal NOC function, one that could easily run $500K or more annually in fully-loaded headcount, to keep it running reliably.
LoRaWAN network server and device management platform considerations#
The LoRaWAN network server (LNS) layer and the device management platform (DMP) you choose above it are separate architectural decisions that most buyers collapse into one. The LNS handles join server operations, MAC-layer routing, and ADR coordination. The DMP, or in an AI-native NOC context, the operations platform sitting above it, determines what you can actually see, alert on, and report against. Conflating the two during evaluation leads procurement teams to over-weight raw connectivity scale and under-weight the operational intelligence layer where real performance differences live.
Security standards and integration compatibility#
Enterprise-grade LoRaWAN security requires more than AES-128 encryption being present in the spec. All serious platforms implement NwkSKey for network integrity and AppSKey for end-to-end payload confidentiality, but the quality of key management practices separates platforms sharply. Over-The-Air Activation (OTAA) with a dedicated join server is the production standard: it enables dynamic session key derivation, prevents replay attacks, and supports re-keying without physical device access. Platforms that still default to Activation by Personalization (ABP) with static keys introduce cryptographic risk that enterprise compliance teams increasingly flag during security audits in regulated industries. For device and network certification specifics, review the official LoRaWAN certification guidance.
Integration breadth matters for enterprise buyers who can’t afford a monitoring island. Leading platforms support MQTT, REST APIs, and native connectors to AWS IoT Core, Azure IoT Hub, and IBM Bluemix. Role-Based Access Control (RBAC) with multi-factor authentication is now table-stakes for platforms serving multi-tenant enterprise clients. AWS IoT Core for LoRaWAN offers deep native cloud integration for organizations already running cloud-native architectures, though its strength is connectivity infrastructure rather than LoRaWAN-specific operational intelligence. Commercial platforms like LORIOT and Actility provide enterprise-grade RBAC with solid monitoring capabilities, but neither was built around the day-to-day operational workflows of a NOC team, the SLA tracking, RF degradation analysis, and capacity planning that define enterprise network operations.
SLA reporting, geospatial analysis, and AI-driven alarm intelligence#
Enterprise clients want proof of coverage, not promises. Geospatial analysis transforms a monitoring platform from a reactive tool into a planning instrument. That means visualizing RF quality across hexagonal coverage zones, mapping gateway positions against device clusters, and identifying geographic gaps, presented together as a coherent coverage picture rather than disconnected data points. Platforms that provide hexagon-based RF heatmaps let operators pinpoint coverage failures before clients report them and build defensible documentation for compliance reviews. Without geospatial context, alarm data is orphaned from the physical network reality it describes.
Most platforms support configurable alarm thresholds, but threshold-based monitoring creates two persistent problems: operators tune thresholds too loosely to avoid alert fatigue, or too tightly and get buried in noise. NOC teams using AI-driven alarm correlation consistently report MTTR reductions of 40 to 70 percent compared to manual threshold monitoring, with some deployments reaching 82 percent improvement as automated correlation eliminates noise before it reaches an operator. Kudzu Canopy NOC** addresses this directly through its AI-powered Action Center and Nomi, an embedded AI assistant that lets operators query any gateway, device, or KPI in plain language and auto-generates compliance-grade SLA adherence reports on demand.** That combination, continuous KPI computation feeding a conversational AI layer, is what separates an AI-native LoRaWAN NOC from a monitoring dashboard with an AI label attached.
SLA reporting has moved from a nice-to-have to a hard procurement requirement for enterprise IoT buyers, particularly in the United States where FCC compliance documentation and SLA adherence proof are increasingly contractually mandated. Operators need to generate compliance documentation, including Certificate of Nominal Operation (CNO) reports, without manually compiling spreadsheets before a client call. Based on enterprise IoT procurement patterns observed across managed service operators, SLA reporting and compliance criteria now account for 20 to 35 percent of total vendor evaluation scores, ranking just behind core technical performance. Platforms that automate this process reduce managed service delivery overhead significantly and create an audit trail that protects operators legally.
How the major platform types compare for enterprise LoRaWAN monitoring#
Actility ThingPark Enterprise is the most comprehensive managed option for operators who need carrier-grade infrastructure. It provides deep RF simulation, batch device provisioning, and roaming support across 50-plus nationwide providers, with hardware-tiered scaling from 2,000 devices on a small appliance to 300,000 on its largest hardware tier. LORIOT Hummingbird targets hybrid LoRaWAN and mioty deployments with end-to-end AES-128 encryption and enterprise RBAC. AWS IoT Core for LoRaWAN integrates natively into the AWS ecosystem, making it a serviceable fit for enterprises already running cloud-native architectures. All three handle scale, but none were designed around the specific operational workflows of a LoRaWAN NOC team managing SLAs and RF performance as core daily functions.
The emerging category that changes the comparison is the AI-native NOC platform built exclusively for LoRaWAN. Kudzu Canopy NOC wasn’t built as a generic IoT manager with LoRaWAN support added later. It was architected from the ground up around LoRaWAN’s specific failure modes, KPIs, and compliance requirements. The result is a closed-loop system: raw telemetry flows into continuous KPI computation, surfaces as prioritized alarms in an AI-driven action center, gets queried through Nomi, and exits as a compliance report. For enterprise operators who need to prove network performance to clients without hiring large NOC teams, that architecture is the meaningful differentiator in the current market.
Building your enterprise evaluation scorecard#
Structure your vendor evaluation around six weighted dimensions, each rated one to five by your procurement team. Weight them based on your operational priorities before you talk to vendors, not after, so the scoring isn’t influenced by whoever gives the best demo.
Scalability: Does the platform support your three-year device growth projection without re-platforming?
LoRaWAN-native KPI depth: Does it compute PDR, RSSI, SNR, and ADR trends natively, or require custom instrumentation?
AI and alarm intelligence: Does it prioritize alarms with context, or flood operators with raw threshold violations?
Geospatial RF analysis: Does it map coverage zones and identify geographic gaps with actionable detail?
SLA and compliance reporting: Can it generate compliance-grade documentation automatically on demand?
Five-year TCO: What does the full cost look like at your projected device count, including operations overhead?
Ask vendors to demonstrate, not describe, their SLA reporting workflow. Request a live walkthrough of how the platform handles a simulated gateway failure: what fires, in what order, and how long it takes to isolate the affected devices geographically. Ask specifically whether the platform computes LoRaWAN-native KPIs at the LNS layer or relies on third-party instrumentation sitting above it. The answers reveal far more than any feature matrix. A platform that can’t walk you through a simulated failure in a structured, confident way during a sales call is a platform that will struggle when your network actually degrades at 2 AM.
The evaluation decision that actually matters#
When you examine how LoRaWAN monitoring platforms compare for enterprise use, the gaps between a generic IoT dashboard and a purpose-built NOC platform grow wider as your network scales. The evaluation dimensions covered here, scalability, security, integrations, geospatial analysis, AI-driven alarm management, and SLA reporting, give procurement teams a structured framework that goes beyond feature checklists and gets to the operational architecture question that determines real outcomes.
The platforms that win enterprise evaluations in 2026 compress problem identification time, reduce critical network failures, and automate compliance documentation without adding headcount. That’s the standard your vendor needs to meet. If your enterprise needs a platform that converts raw LoRaWAN telemetry into guided operator action at that level, put Kudzu Canopy NOC’s AI-native architecture to the test against your deployment scale directly.